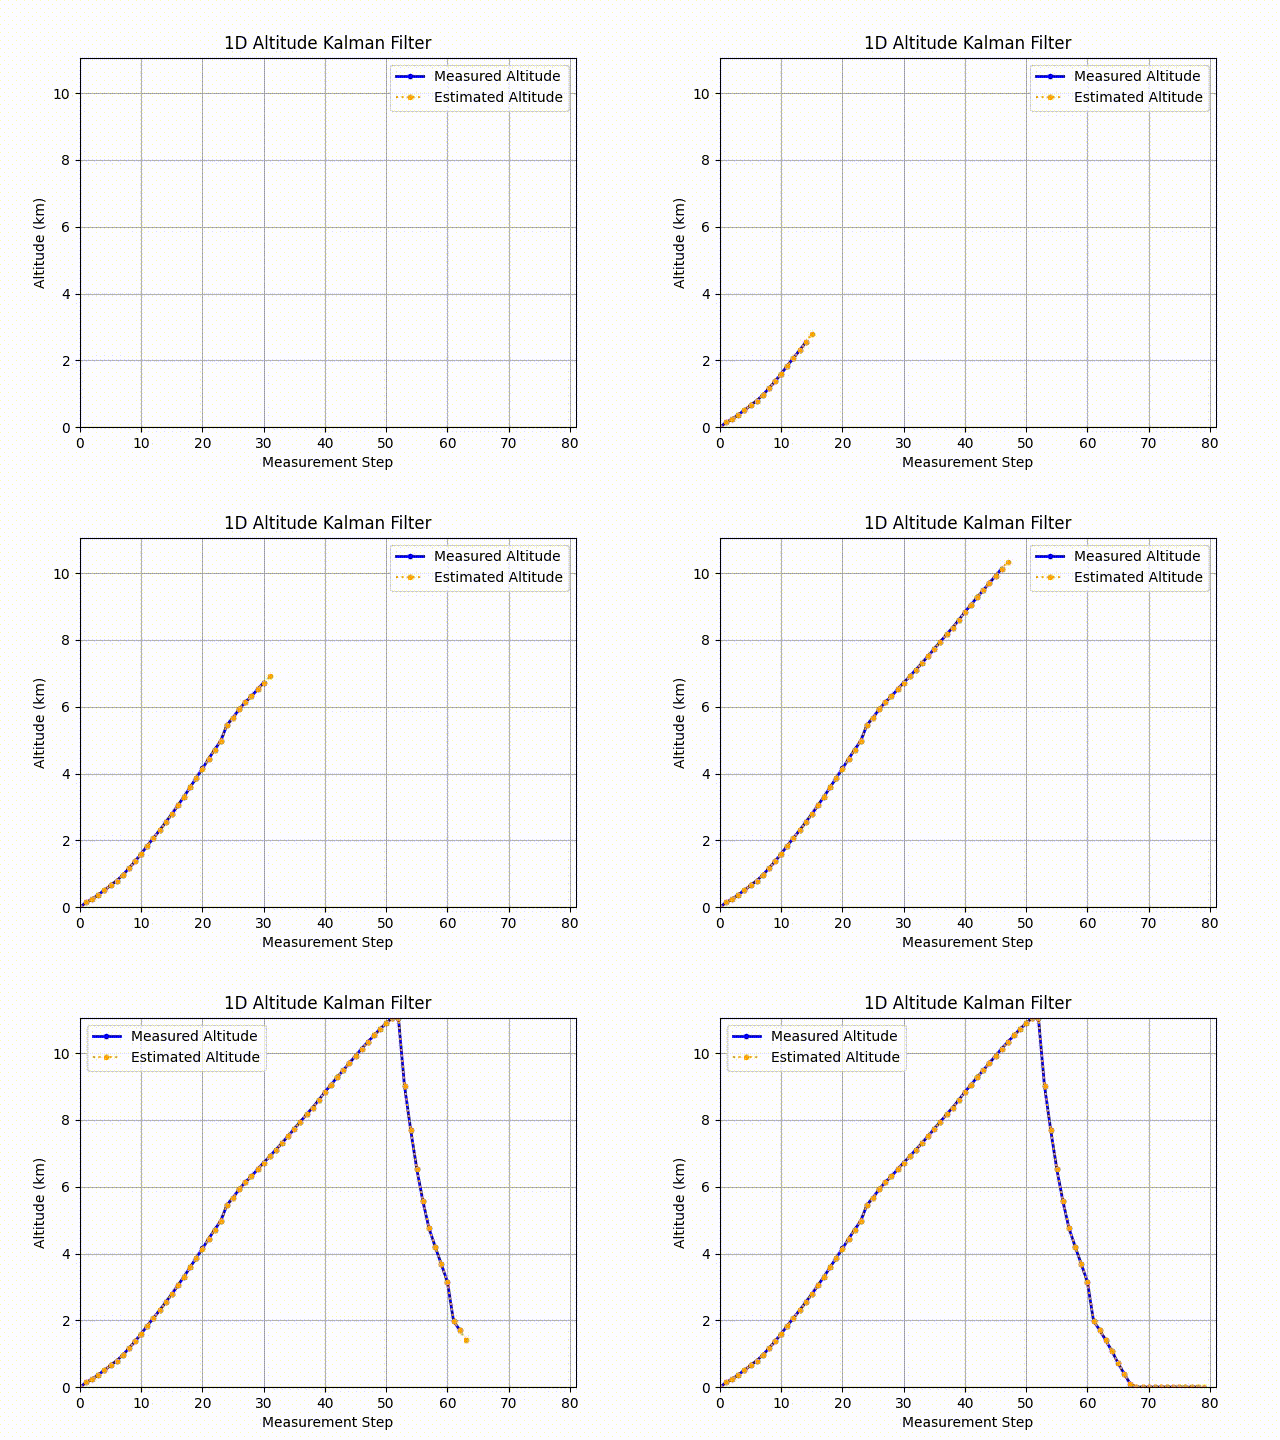
From my previous post, I’ve been working on a live-updating prediction model for an APRS-based weather balloon. I am happy to report I have made some minor progress. Take a look!
Background - The Kalman Fitler
The Kalman Filter is a digital filter used for estimation and future predictions in many signal processing and statistical fields. One of its clearest use-cases is a position estimator for moving objects. As an algorithim, the filter consists of three “steps”:
- Initialization - defining variables at the beginning of the process
- Prediction - using past variables, predict future values
- Correct - using measured values and the prediction, correct the next prediction.
Essentially the filter operates as a continuous algorithim after an initialization. It predicts a value, then uses a measurement to see how far it was off. This error is used to predict the next value, and so on!
The filter can effictively predict models after a training period. The error is adjusted with the Kalman Gain to weight the estimate of the model.
Initialization
Be warned of some statistics ahead.
The filter is initialized with the following variables:
- Initial estimate $\hat{y}[-1\vert-1]$
- Intial error estimate covariance $R_{\tilde{y}}[-1\vert-1]$
These estimates can be generalized to the following, respectively:
- $y[-1]$: The initial state
- $R_y[-1]$: The initial covariance
Additionally, the following inputs are needed:
- $A$ and $B$, the state prediction matrices
- $R_{\eta}$, The state prediction covariance
- $H$, the Data/measurement filter
- $R_v$, the “innovation” covariance
- $x[n]$, the measurements
We are predicting $y[n]$ but are given $x[n]$ as measurements. Based on the data we have, $x[n]$ is the best estimate of $y[n]$. Sorry if this is confusing.
Prediction
The filter predicts the following values:
- $\hat{y}[n\vert n-1]$, the state ahead
- $R_{\tilde{y}}[n\vert n-1]$, the error covariance ahead
Correction
The filter computes the following values to correct its prediction:
- $K[n]$, the Kalman Gain
- $\hat{y}[n\vert n]$, The signal update with measurement $x[n]$
- $R_{\tilde{y}}[n\vert n]$, the updated error covariance
The predict and correct steps run continuously until a linear estimation is made (see “predictive model”) or until one estimation after measurements run out (think about it for a second).
1D Application
The relevant physics description for applying a kalman filter to a 1D process (like altitude of a weather balloon with random accelleration) can be found aptly here. I use the same general principles but in a more signal-processing, filter-oriented process.
Live-Updating Filter
Using archived exported data from aprs.fi, I downloaded a CSV of W2KGY’s March 23, 2022 Weather Balloon Flight. (Note: The video is from the February Launch, but I can’t find anything online from the April launch. Blame the person in charge). I used just the altitude data converted to km - about 110 values.
Using kalman equations with code published on github, I was able to predict future states from the past estimates. Below is a gif of the result:

As you can see, based on the information given the best estimate is the previous measurement.
Predictive Model
The error of the Kalman filter is unique. Instead of depending simply on the current state, it depends on all previous measurements and predictions. Thus the estimate is more precise as the number of estimates increase.
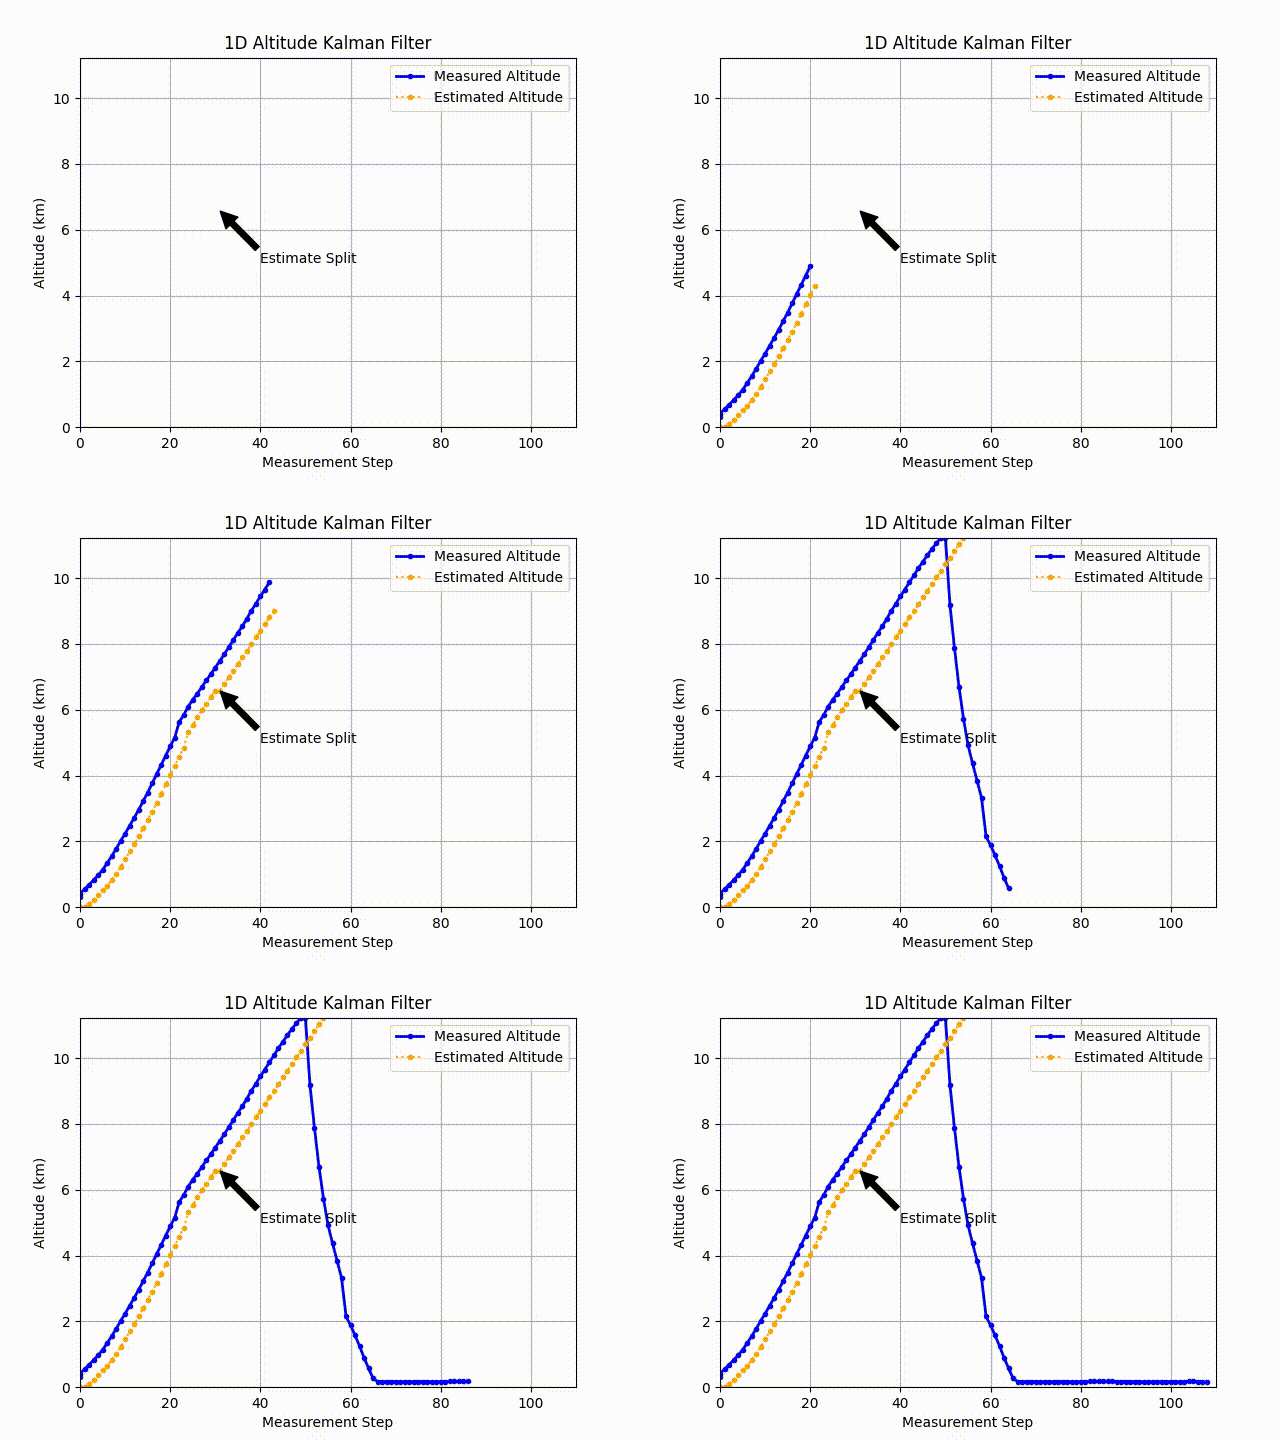
To see this, I “trained” the filter on about 31 measurements of the altitude. The thought behind this was to give an eventual landing site (n=100) based on what little data is available.

You can see it’s a pretty close estimate (and probably a constant upward velocity / low acceleration) up to the balloon burst. Past this point, the kalman filter fails to provide any meaningful data. Potentially if we can predict the time of the burst (based on an altitude estimate or a time), we could introduce a different model to predict the trajectory downward.
With the previous statement, I then wonder what meaningful information the first 30 measurements of the altitude provides in a physical setting. Horizontal windspeeds would potentially slow the ascent of the balloon, so getting real measurements of the ascent could give a helpful model of the descent.
Next Steps
This work will go in two directions. First, I’ll be using 2 dimensions to estimate the XY-positon and possile landing site of the balloon. There is some more complicated matrix math involved since both x and y have their respective velocities.
Next, after some discussions with colleagues I’m wondering if the kalman filter can anticipate an event like the burst. We know it’s going to pop past a certain altitude; is the descent some faster multiple (5x, etc) of the ascent? Can we use a different model for the descent? Does the entire altitude follow some function?
Finally, I hope to combine all these variables with weather measurements to make a better predictor. I hear my favorite prediction tool, habhub may be sunset eventually. I want a reliable tool based on the data we’ve seen.